2026 Annual Household Asset Reduction Report

The Official ROI Report of Owning Fewer Things

A Fiscal Analysis of Domestic Simplification

Prepared by
Department of Personal Inventory Optimization
Reporting cadence
Quarterly
Primary metric
Calm Index (directional)
A calm, minimalist home office illustration with a single plant, a clear desk, and plenty of open space.
Operational environment following baseline simplification measures.
Calm Index (FY 2026)
Calm Index trending upward Four quarterly bars rise from Q1 to Q4, indicating a modest increase in the Calm Index. Q1 Q2 Q3 Q4 Calm Index ↑ trending

Method note: Calm Index is a composite of surface visibility, time-to-locate, and background mental tracking load. Values are directional and reported without unnecessary enthusiasm.

Executive Summary

This year, we reduced physical assets by 18%.

Closet Compression

+34% improved

Hangers now operate with less interlocking resistance.

Search Time

−11 min/week

Lost items surfaced with fewer meetings.

Emotional Friction Events

marginal

Not eliminated; merely reclassified.

Drawer Openability

Stable operational

No longer requires shoulder involvement.

Q1: Asset Liquidation Phase

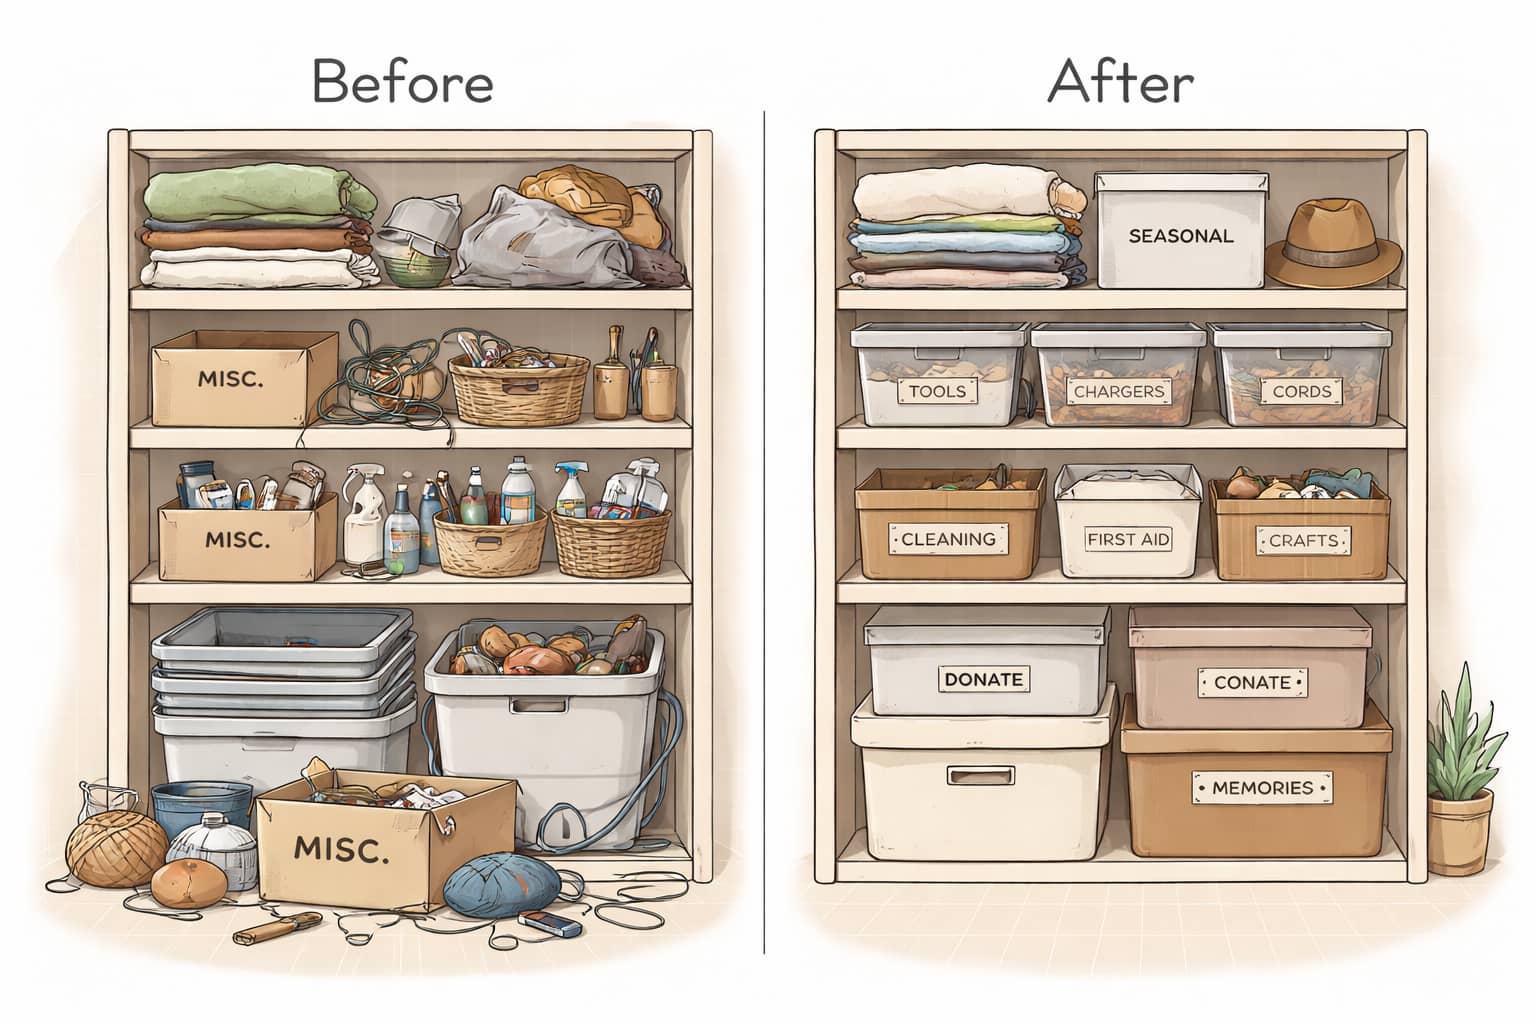
Initial Downsizing Initiative

Actions Taken

  • Removed duplicate kitchen tools.
  • Reassigned 14 “someday” items to external ownership.
  • Closed one drawer permanently.

Measured Outcomes

  • Immediate surface visibility increase.
  • 2 instances of misplaced nostalgia.
  • 1 moment of hesitation.
Quarterly timeline: liquidation to stability
Q1 timeline A single horizontal bar with three labeled checkpoints: duplicate removal, someday reassignment, drawer closure. Duplicates removed “Someday” items reassigned Drawer closed Surface clears Decision load drops Operational calm

Q2: Storage Optimization

Spatial Reallocation

Initiatives

  • Introduced container labeling system.
  • Eliminated one “miscellaneous” box.
  • Retired 3 unused organizational bins.
A before-and-after illustration of a shelf: the left side crowded with mixed items, the right side labeled and spaced with fewer objects.
Before/after shelf diagram: labeled, reduced, and visibly breathable.

Q3: Productivity Gains

Operational Efficiency Improvements

Data Points

  • Morning preparation time reduced by 6%.
  • Lost charger recovery rate improved significantly.
  • Desk clearing no longer required pre-cleaning.

Footnote: Focus improved, though unrelated scrolling persisted.

Line graph: “Time to Leave the House” (lower is better)
Time to Leave the House decreases A downward trending line from Q1 to Q4, with gentle markers at each quarter. Q1 Q2 Q3 Q4 Minutes Time to Leave the House

Q4: Psychological Dividends

Intangible Returns (Measured)

Measured Gains

  • Reduced background mental inventory tracking.
  • Fewer micro-decisions about where to place items.
  • Noticeable increase in “visual quiet.”

These gains were observed most clearly in the five seconds after entering a room and before noticing anything else.

Quarterly indicators (directional)
Directional psychological indicators Three horizontal bars show decreases for clutter volume and cognitive static and a smaller decrease for inner commentary. Clutter Volume Cognitive Static Inner Commentary → slightly reduced Lower is better. Reporting remains calm.

Cost Analysis

Total Investment Required

Costs Included

  • 7 hours of sorting.
  • 3 moments of doubt.
  • 1 argument about whether something is “still good.”
  • Temporary mess spike (18%).

Expense classification: time, emotion, negotiation, and controlled disorder.

Expense ledger (household internal)
Line item Unit Quantity Notes
Sorting labor hours 7 Includes brief re-sorting of the sorting piles.
Doubt events moments 3 Peaked near “gift items” and “backup cables.”
Negotiation arguments 1 Resolved via compromise and a deadline.
Mess spike % 18 Short-lived; visually intense; ultimately strategic.

All costs recorded at time of occurrence; no attempt made to retroactively seem wise.

Risk Disclosure

Forward-Looking Statements

Potential Risks

  • Re-accumulation during holiday season.
  • Emotional attachment to “empty space.”
  • Purchase of decorative storage baskets.

Minimalism performance may vary by household, calendar, and proximity to home-goods aisles.

Risk allocation (approximate)
Risk allocation pie chart Three slices depict the relative contribution of risks to re-accumulation: holiday season, decorative storage baskets, and sentimental exceptions. Holiday re-accumulation Decorative baskets Sentimental exceptions All allocations are estimates and may drift under gifting conditions.

Year-End Balance Sheet

Results as of fiscal close

Assets Removed

214 items

Disposition methods included donation, recycling, and decisive release.

Surface Area Recovered

19% visible

Counters regained their original purpose: existing.

Time Saved

9.5 hrs/yr

Primarily from reduced searching, re-stacking, and re-deciding.

Peace Increase

Noticeable (unpriced)

Recorded as a qualitative asset with measurable side effects.

Debits

  • Sorting hours
  • Temporary mess spike
  • Negotiation overhead
  • Revisiting old stories

Credits

  • Clearer surfaces
  • Fewer searches
  • Lower decision load
  • More visual quiet

Closing Statement

Final Determination

After extensive analysis, we conclude:
Owning fewer things does not create a new person.
It creates slightly fewer decisions.
Which compounds.
Modestly.

No transformation claims were made in the preparation of this report.

Marginal Gains (cumulative)
Marginal Gains upward arrow An upward arrow rising gently from left to right with the label Marginal Gains. Marginal Gains Direction matters more than drama.